Four Levels Of Customer Understanding

Many companies think they know fairly well what their users want and need, and how they make their decisions. Yet most of the time these are merely big assumptions and big hunches — with little real evidence to support them. In practice, obvious reasons might be true, but they rarely paint the full picture.
To understand our customers, we must triangulate across four levels of customer understanding by Hannah Shamji. It’s a useful way to think about the underlying reasons for user behavior, hidden motivations, and the complex layers of messy and noisy reality that are often overlooked. Let’s see how it works.
To learn about customers, it might seem reasonable to ask people what they think and draw conclusions from it. But it’s rarely an effective way to get actionable answers. In fact, as it turns out, what people think, feel, say, and _do_ are often very different things.
As Erika Hall wrote, asking a question directly is the worst way to get a true and useful answer to that question. We don’t always understand or are aware of our true motivations. We often apply our own context and interpretations to questions.
We also exaggerate (a lot!). We focus on edge cases and unrealistic scenarios, and we favor short-term goals over long-term goals. So if users say that they absolutely need to compare products in a table, it doesn’t mean that they couldn’t get to their underlying goal without it.
“Possible” vs. “Probable”Just to indicate how tricky listening to words alone is: even little nuances in words chosen matter. In practice, users are rarely precise in expressing their thoughts, and a good example is the distinction between possible, plausible, and probable, as discovered by Thomas D'hooge.
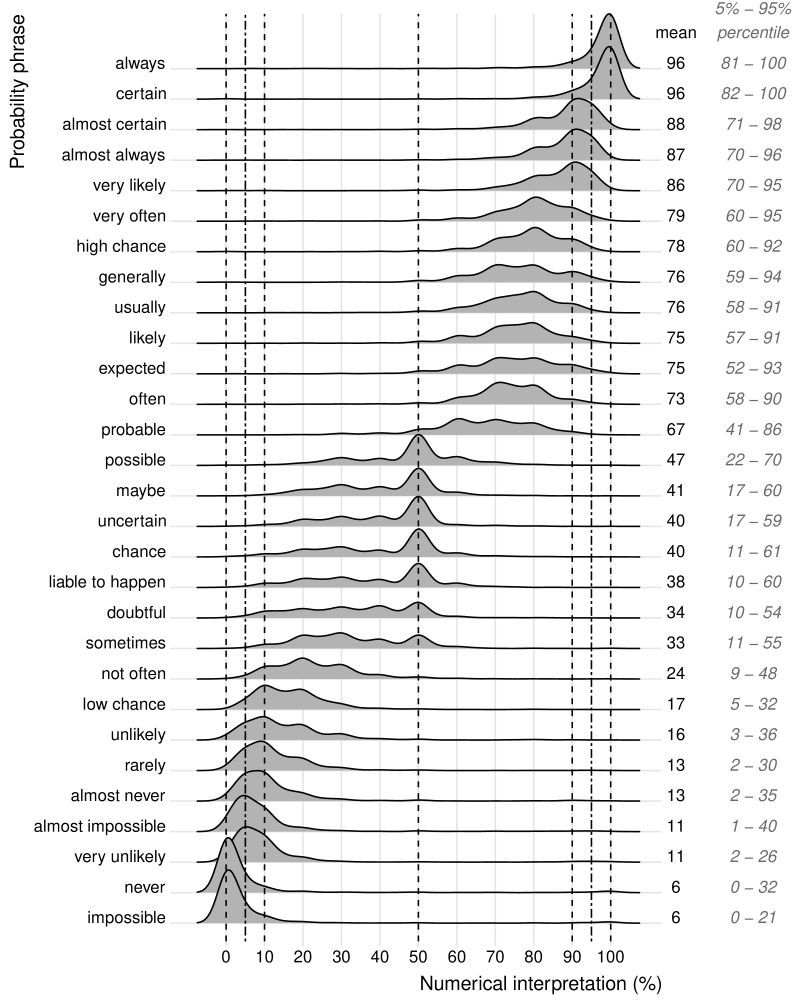
A study on Dutch verbal probability terms shows how unreliable the choice of words is. While extreme words have some agreement, terms like “possible,” “maybe,” “uncertain,” or “likely” lead to a wide spread of interpretations. So we shouldn’t rely on what people say, but rather try to go deeper.
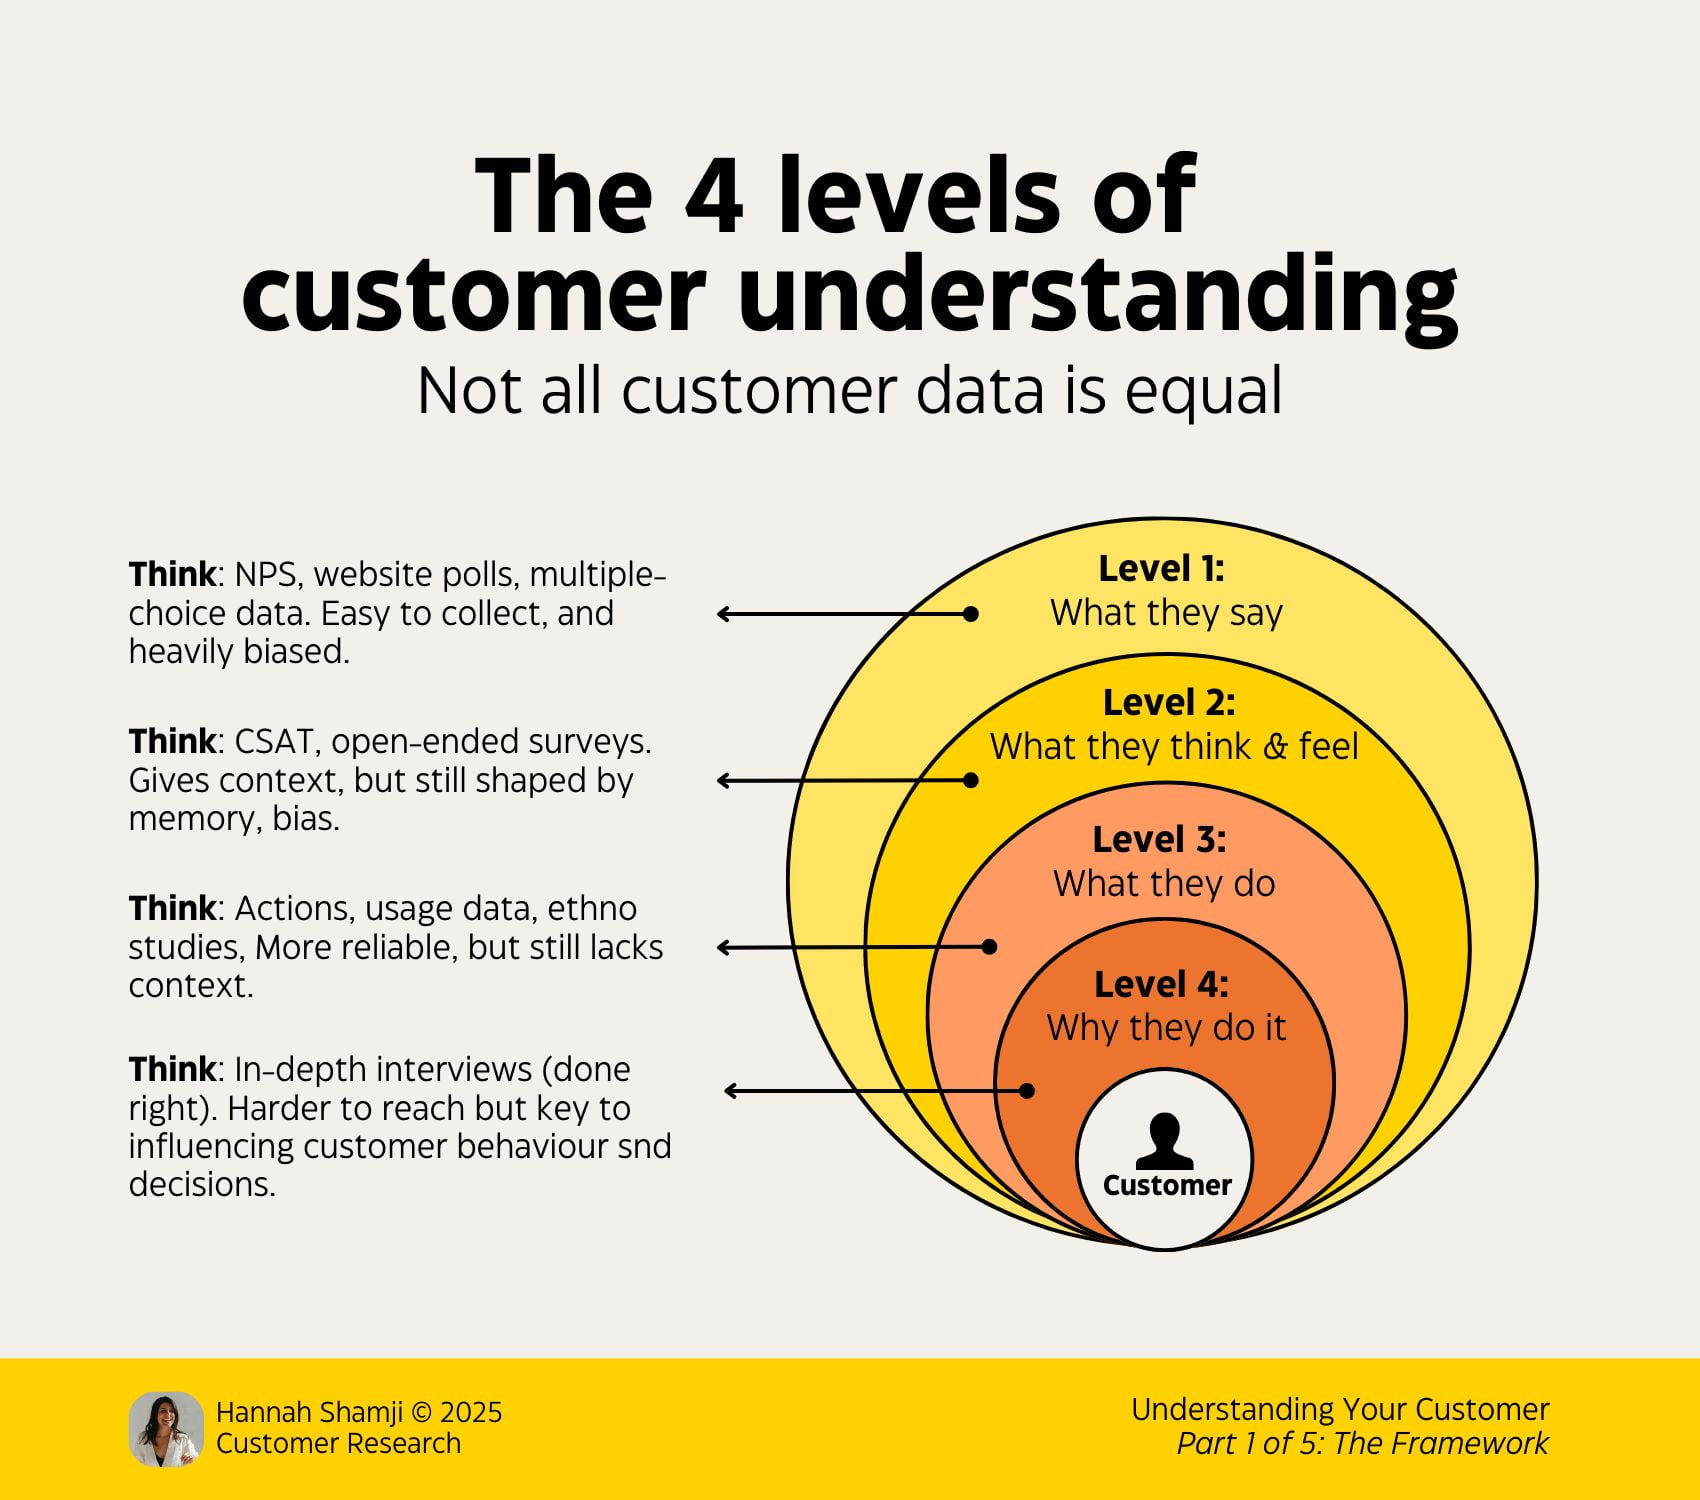
The Levels Of UnderstandingTo get a more realistic and less biased view of customers’ needs, we need to understand a broader picture across 4 levels:
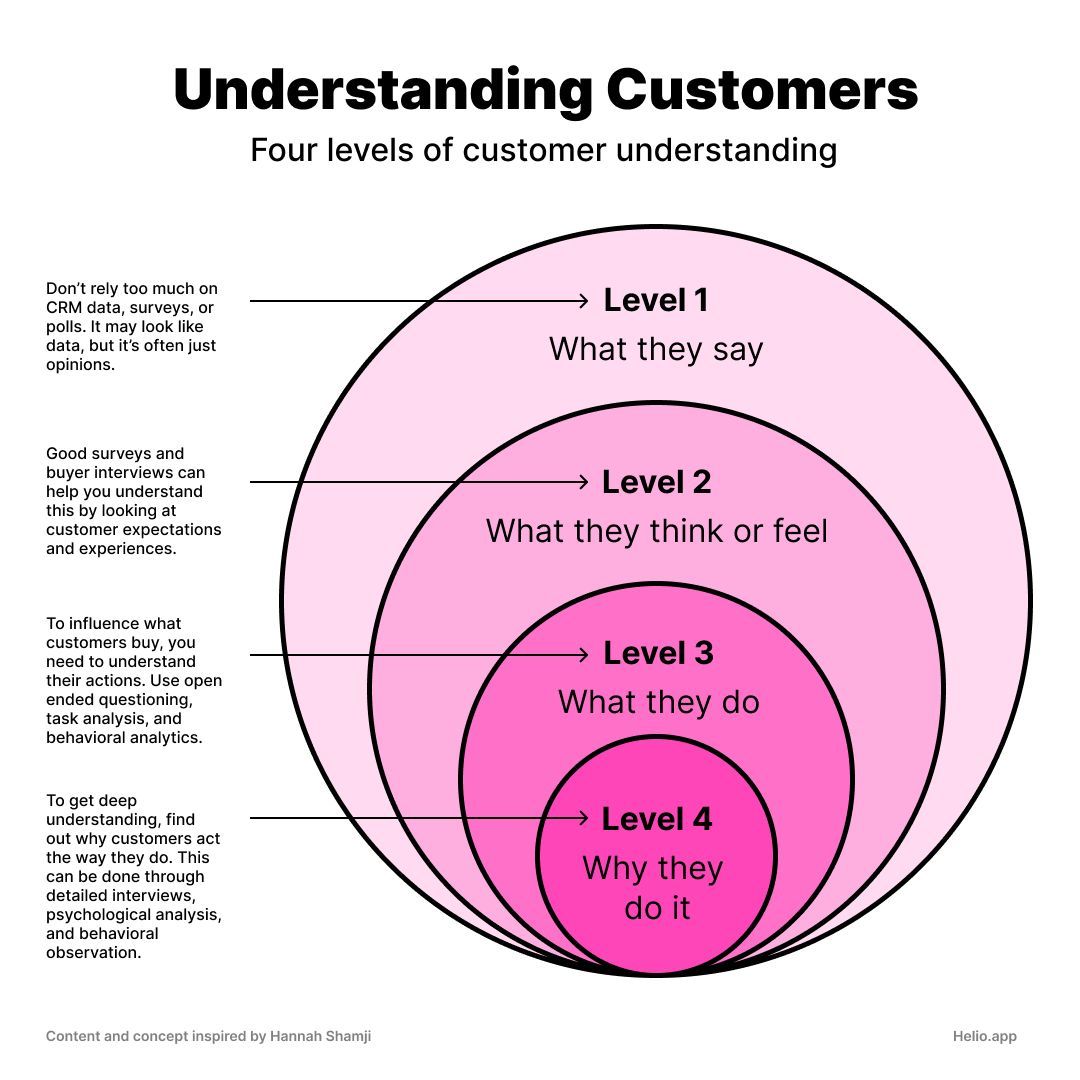
- Level 1: “What they say”
Easier to collect, but mostly opinions, and most unreliable. People often explain their behavior through the lens of how they perceive it, or how they want it to be perceived, which isn’t always accurate. We shouldn’t rely too much on CRM data, surveys, or polls. - Level 2: “What they think and feel”
Gives more context, but is still heavily shaped by memory and personal preferences. Good user research and interviews help us understand expectations and experiences. - Level 3: “What they do”
We study actual behavior, actions taken or skipped, usage data, and analytics. We run task analysis and workflow analysis to understand how people use the product. - Level 4: “Why they do it”
We study underlying motivations and root causes, through observations of real workflows and in-depth interviews. Typically, it requires a trustworthy relationship with the user, repeat interviews, and task walkthroughs.
Personally, I wouldn’t recommend NPS (alternative). It’s worth noting that different levels might reveal conflicting or contradictory data. To get a better understanding, we need to triangulate and reconcile data with mixed-method research.
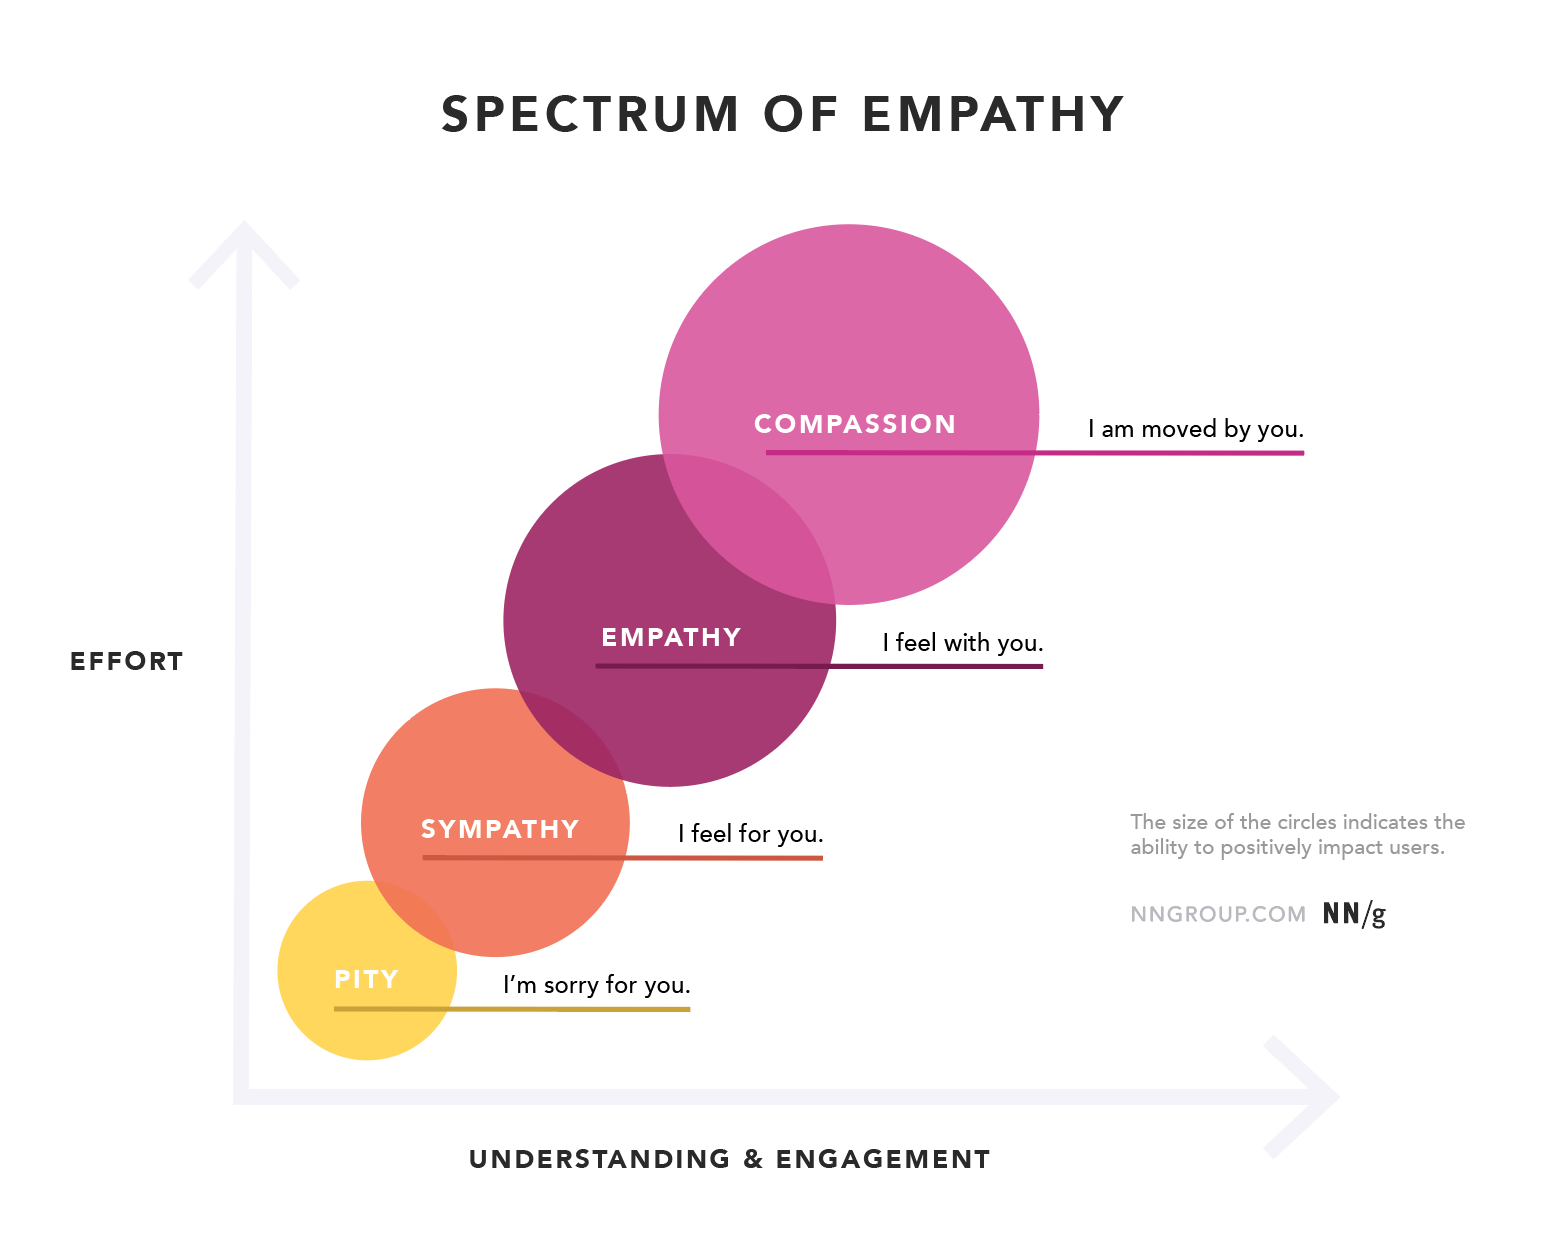
Capturing Emotions And NuanceEmotions are always difficult to capture, but they are easier to spot once you observe people doing what they need to do without external influence or interruptions. The ability to positively impact users grows by moving from sympathy to empathy or even compassion, as articulated by Sarah Gibbons.
In the past, I was using “speak-aloud” protocol and asked users to walk me through their thought process as they were completing tasks. But it actually turns out to be quite disruptive. Because people are focused on speaking at the same time while solving a task, many emotions remain hidden or obscured by their language.
So, when conducting usability testing, I don’t ask users to speak through their experience. Instead, I observe where they tap or hover with the mouse, where their mouse circles without an action, where they scroll, and how long. Eventually, when a user confirms that they are done or that they are stuck, I ask questions.
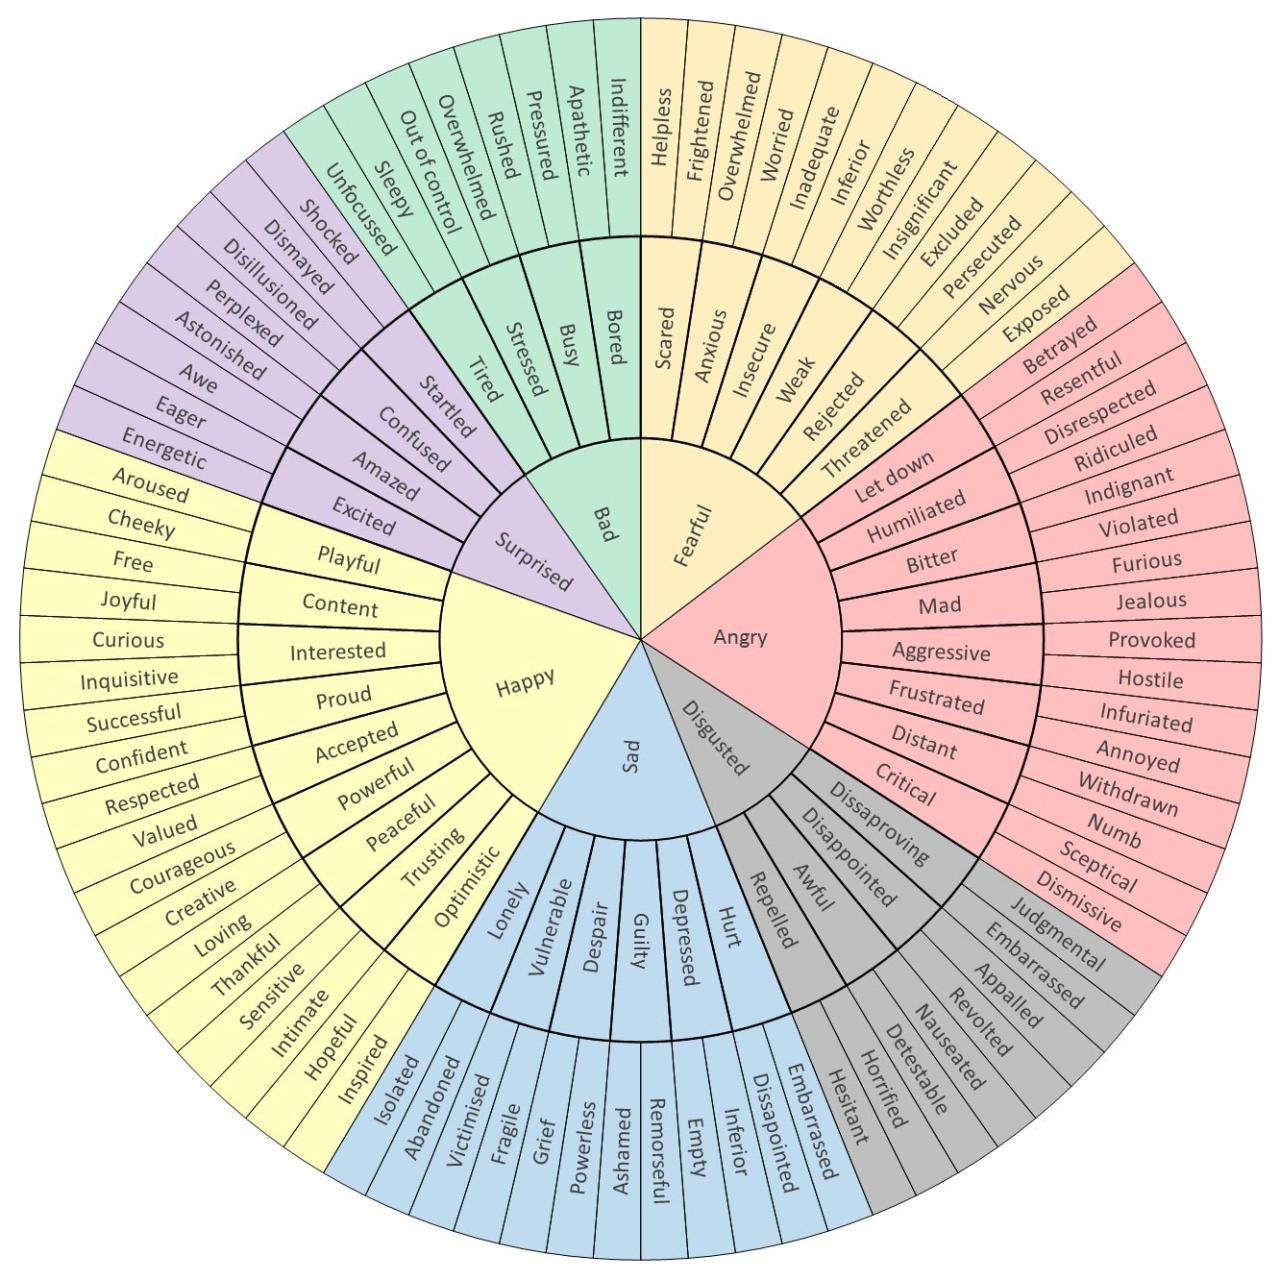
The Emotion Wheel (website) by Geoffrey Roberts is a helpful little tool for better describing a range of emotions during user interviews or design sessions. It certainly needs refinement for product design needs, but it helps us get more precise about the sentiment customers or colleagues might be experiencing, moving beyond just “good” or “bad”.
One helpful trick is to use mirroring — repeating what a user has said, or ask the same question twice, just paraphrasing it. Or navigating the emotions wheel (see above) to better capture and understand the emotion.
These strategies help uncover some of the issues that perhaps didn’t come up in the first answer. That’s also when a user tends to add more useful context and details as they explain their confusion.
Emotions Aren’t EverythingSome people strongly disagree:
“Our work is about others — their problems, their pain, their mess. Our job is to make sense of it and then do something about it. Not to emote or perform but to act on and solve it. There is a flawed belief that to build great things, you first need to emotionally fully absorb someone else’s experience.”
— Alin Buda
I think that Alin brings up a very strong argument, and personally, I find it difficult to disagree with. However, I do see user’s emotional response as a signal of how well the product is working for them. How engaged or detached they are in their journey, how they react to aesthetics, how confused or confident they are.
Ultimately, these are signals. To make a difference, we must go beyond emotions and explore what people actually do. Usually, this means relentlessly observing, diagnosing, and focusing on underlying user needs.
Observe And Diagnose, Don’t ValidateInstead of asking, we need to observe. Usually, I focus on small things that make or break an experience. I see where users lose time, repeat actions, hover without clicking, or click and then go back. Pay attention to subtle cues like scratching their neck, raising eyebrows, or expressions of worry, joy, or confusion.
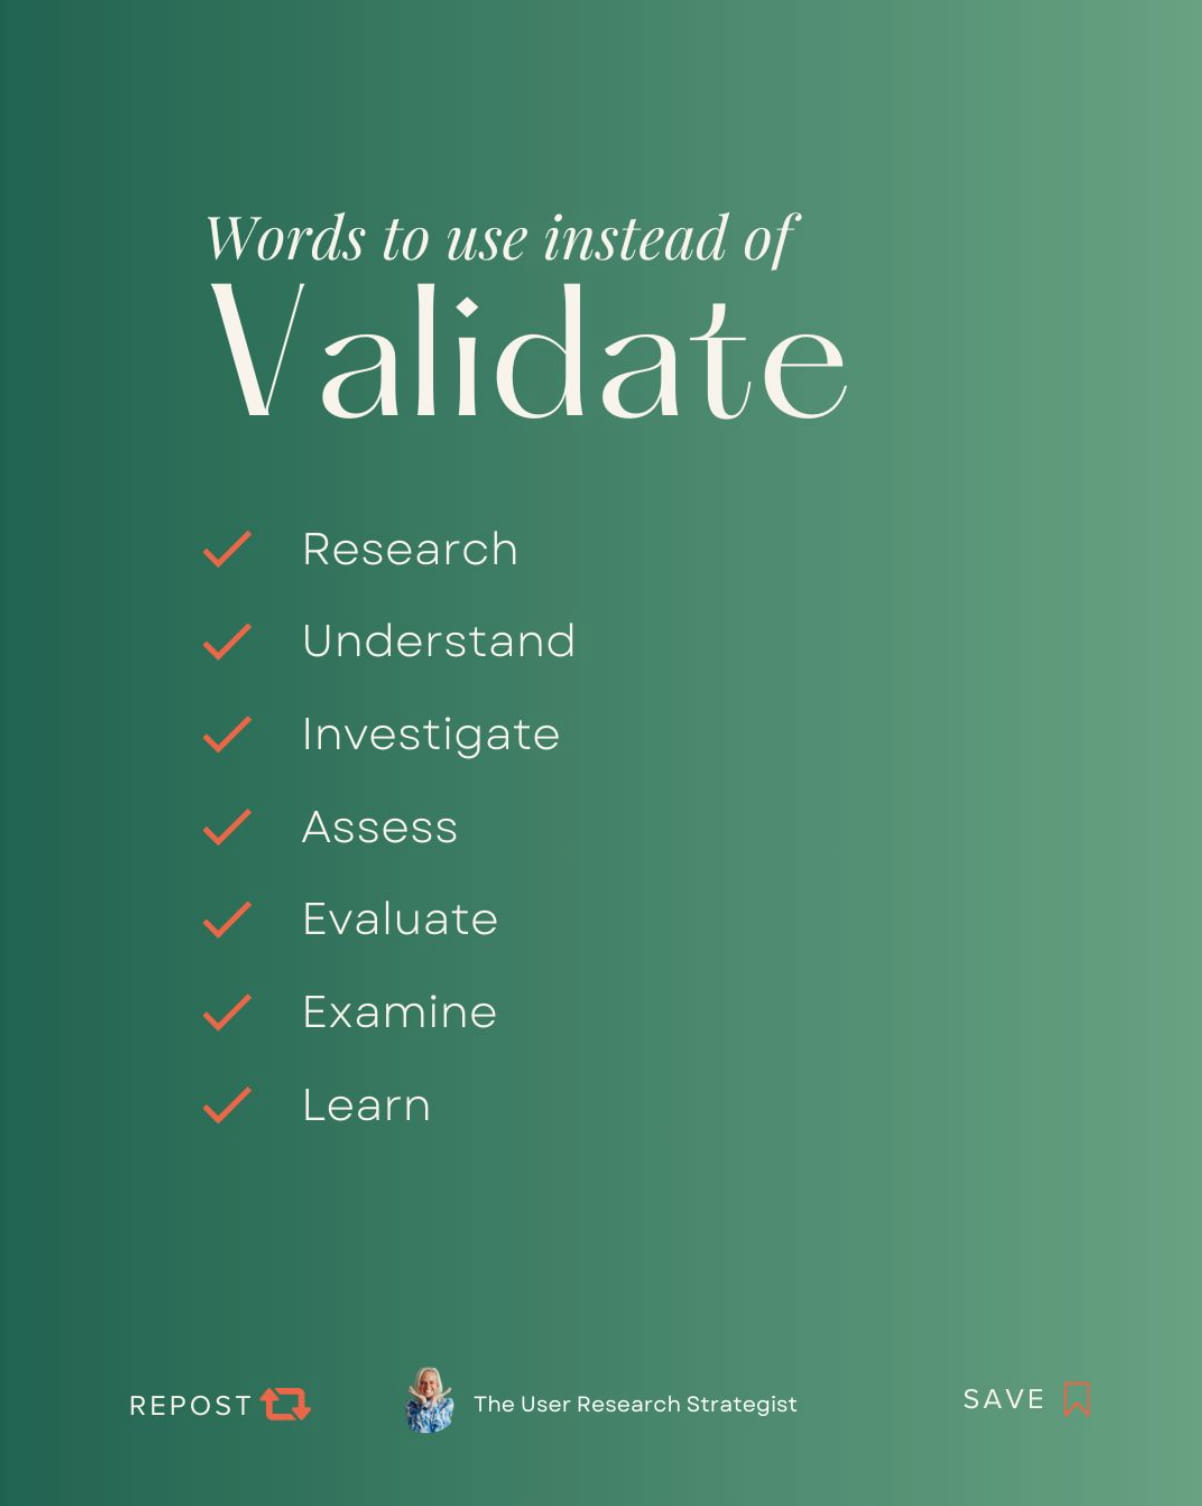
Many companies talk about “validation” through user testing, but often that means simply confirming existing assumptions. But we should instead diagnose existing behavior without preconceived notions or affiliations. We don’t validate — we actually research instead.
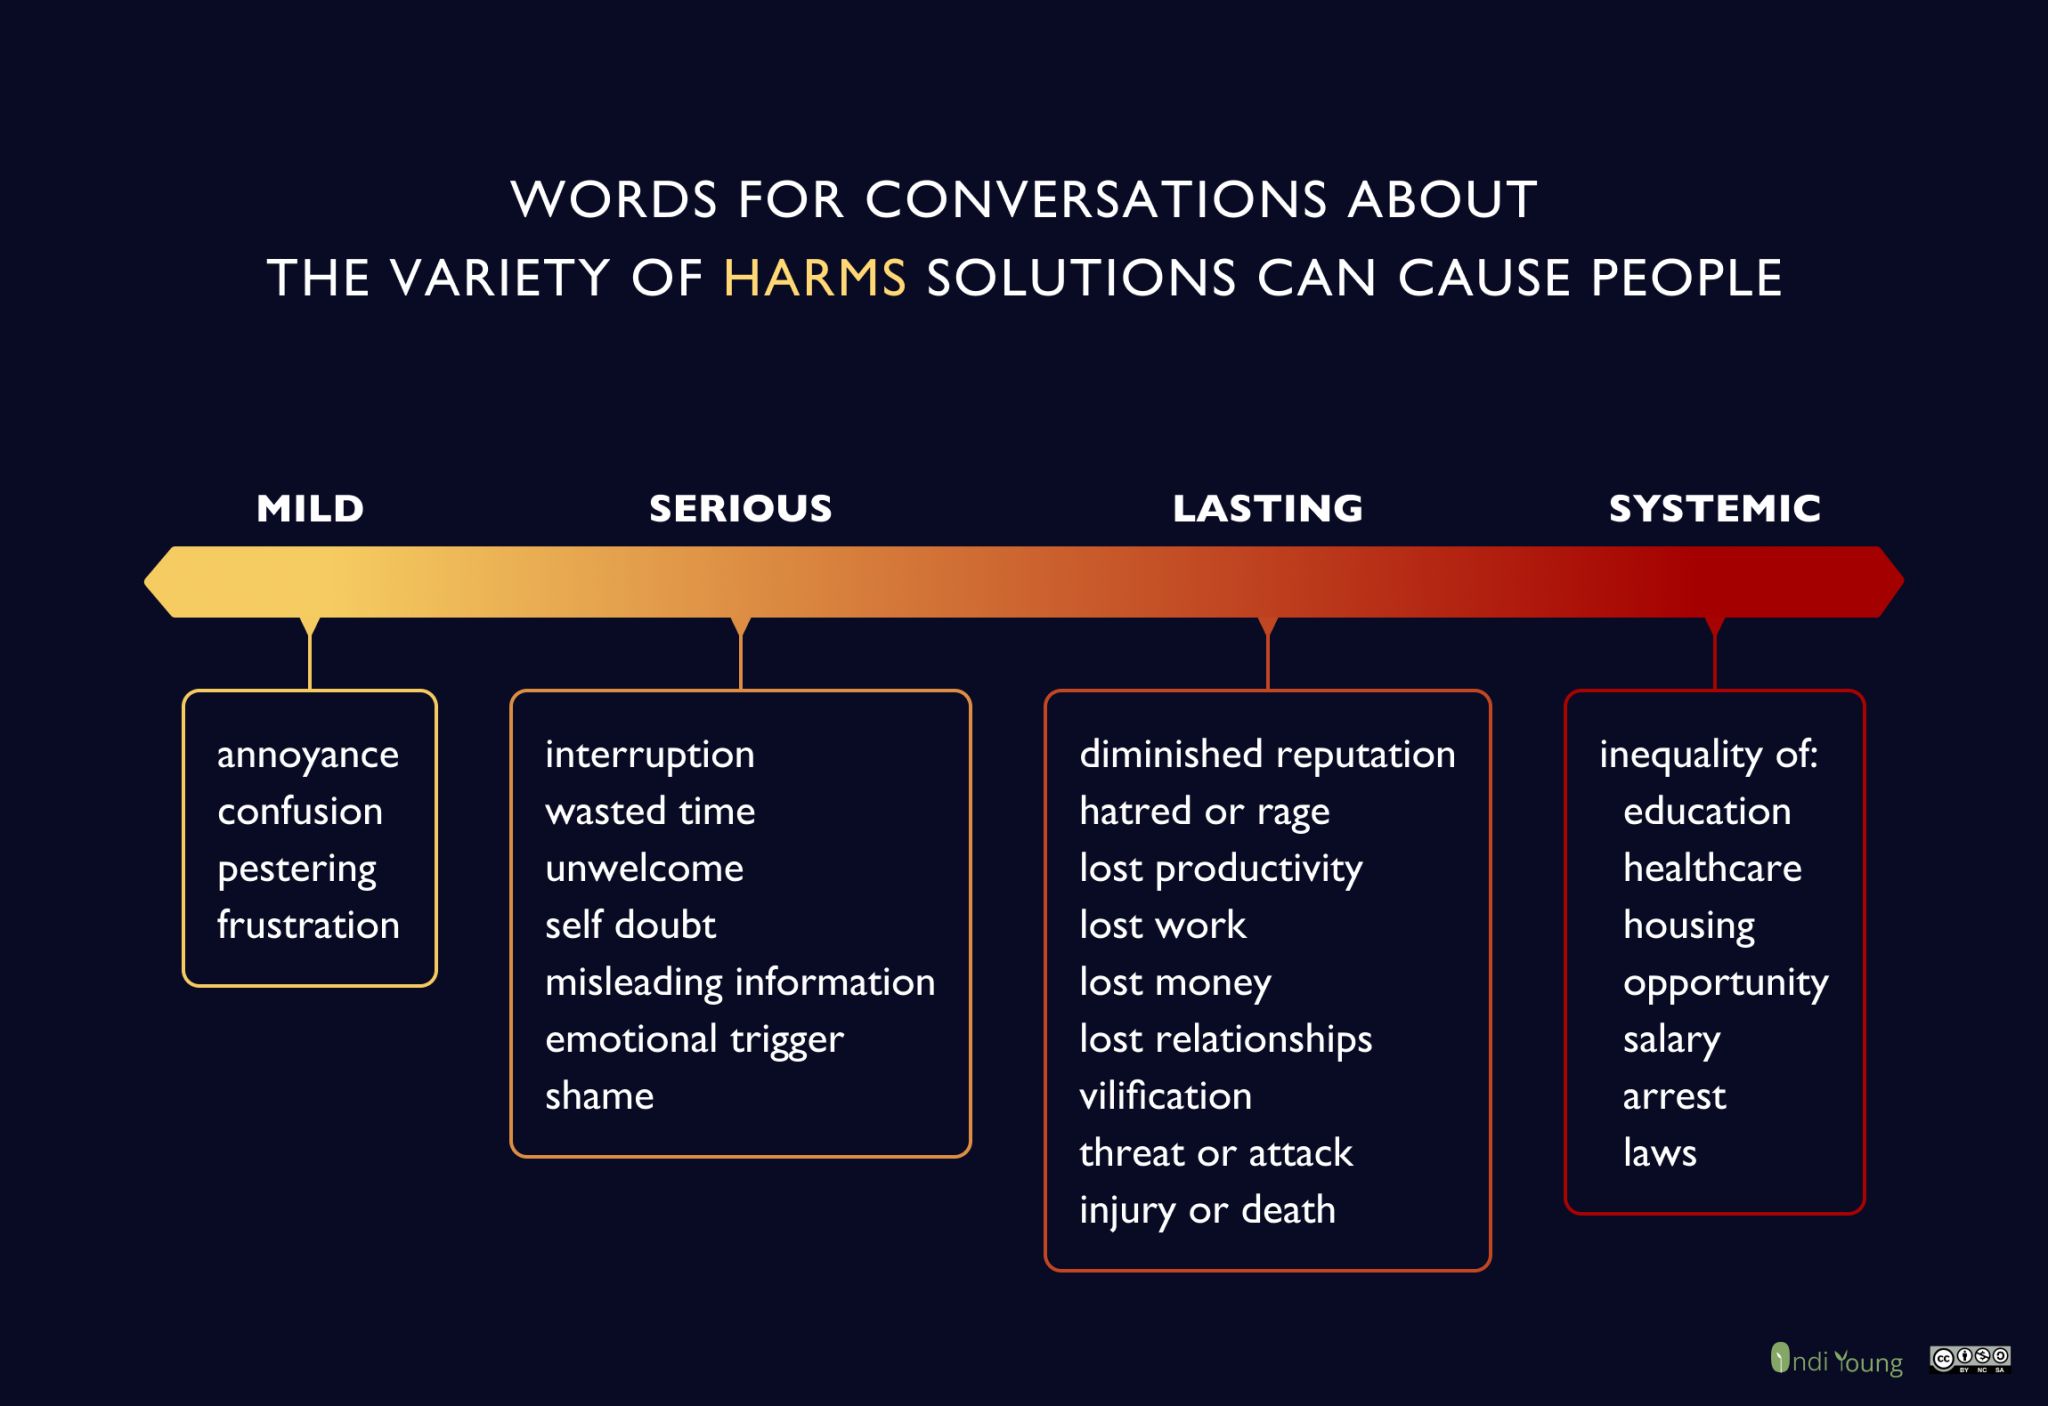
That research means not just understanding customers’ real motivations, but also risks, doubts, concerns, worries, and perhaps even harms.
The only way to get there is by building a sincere, honest, and trustworthy relationship — one that feels right and resonates deeply. When customers truly care and want to help, getting to a real understanding becomes much, much easier.
Practical Ways To Uncover User NeedsWe don’t need expensive tools to uncover user needs. David Travis provides a fantastic overview of helpful strategies to do just that. Here are some initiatives to spread the word about real user’s struggles or gain a deeper understanding of user needs:
- Exposure hours, when every employee must be exposed to their customers for at least 2 hours every 6–12 weeks.
- Live UX testing, where we invite everyone in the company to join and observe.
- Co-design with users, where we show new features and ask users to rank them.
- Helpdesk insights, where we ask for frequent complaints and questions from the support every 3–6 months.
- Listening in, where we tune in on a customer service call, web chat, or eavesdrop where users hang out.
The core idea here is that you don’t need extensive and expensive tools to uncover user needs. You need to create spaces where customers’ struggles can be exposed and make these struggles visible across the entire company.
It can be short video clips of user sessions or a monthly newsletter with what we learned this month. Making these pain points visible can rally everyone from marketing to engineering to keep users’ struggles at the back of their minds.
Wrapping UpTo make an impact, we must go way beyond user feedback. It’s never enough to listen to surveys — we must observe customers’ actual behaviors and build relationships to truly understand their goals and their motivations.
And most importantly, we need to understand what questions we actually want to have answered. Not what “validation” we need to move on with the project, but what we don’t know and what we need to research.
Without it, everything else is merely hunches and assumptions — and often wrong and expensive ones.
Meet “Measure UX & Design Impact”Meet Measure UX & Design Impact, Vitaly’s practical guide for designers and UX leads on how to track and visualize the incredible impact of your UX work on business — with a live UX training later this year. Jump to details.
 Meet Measure UX and Design Impact, a practical video course for designers and UX leads.
Video + UX Training
$ 495.00 $ 799.00 Get Video + UX Training25 video lessons (8h) + Live UX Training.
100 days money-back-guarantee.
Video only
25 video lessons (8h). Updated yearly.
Also available as a UX Bundle with 3 video courses.
- Four Levels of Customer Understanding, by Hannah Shamji
- 60 Ways To Understand User Needs, by David Travis
- Emotion Wheel Toolkit (PNG), by Geoffrey Roberts
- Feelings Wheel PDF
- Feelings Wheel Online
- My Case Against Empathy, by Alin Buda
- Possible vs. Probable, by Thomas D’hooge
- Communicating probability: a multinational study of the interpretation of verbal probability terms, by Maarten C. de Vries, Marjolijn L. de Boer, and Martine Bouman.
Useful Books
- Deploy Empathy: A practical guide to interviewing customers, by Michele Hansen
- Humankind, by Rutger Bregman
Want to read more?
Check out the full article on the original site